Your Average Response Time Looks Good. What Are Your Customers Experiencing?
A good average first response time can hide one slow channel. Channel, hour and agent views help care teams rebalance before complaints pile up.
 Nov. 6, 2026
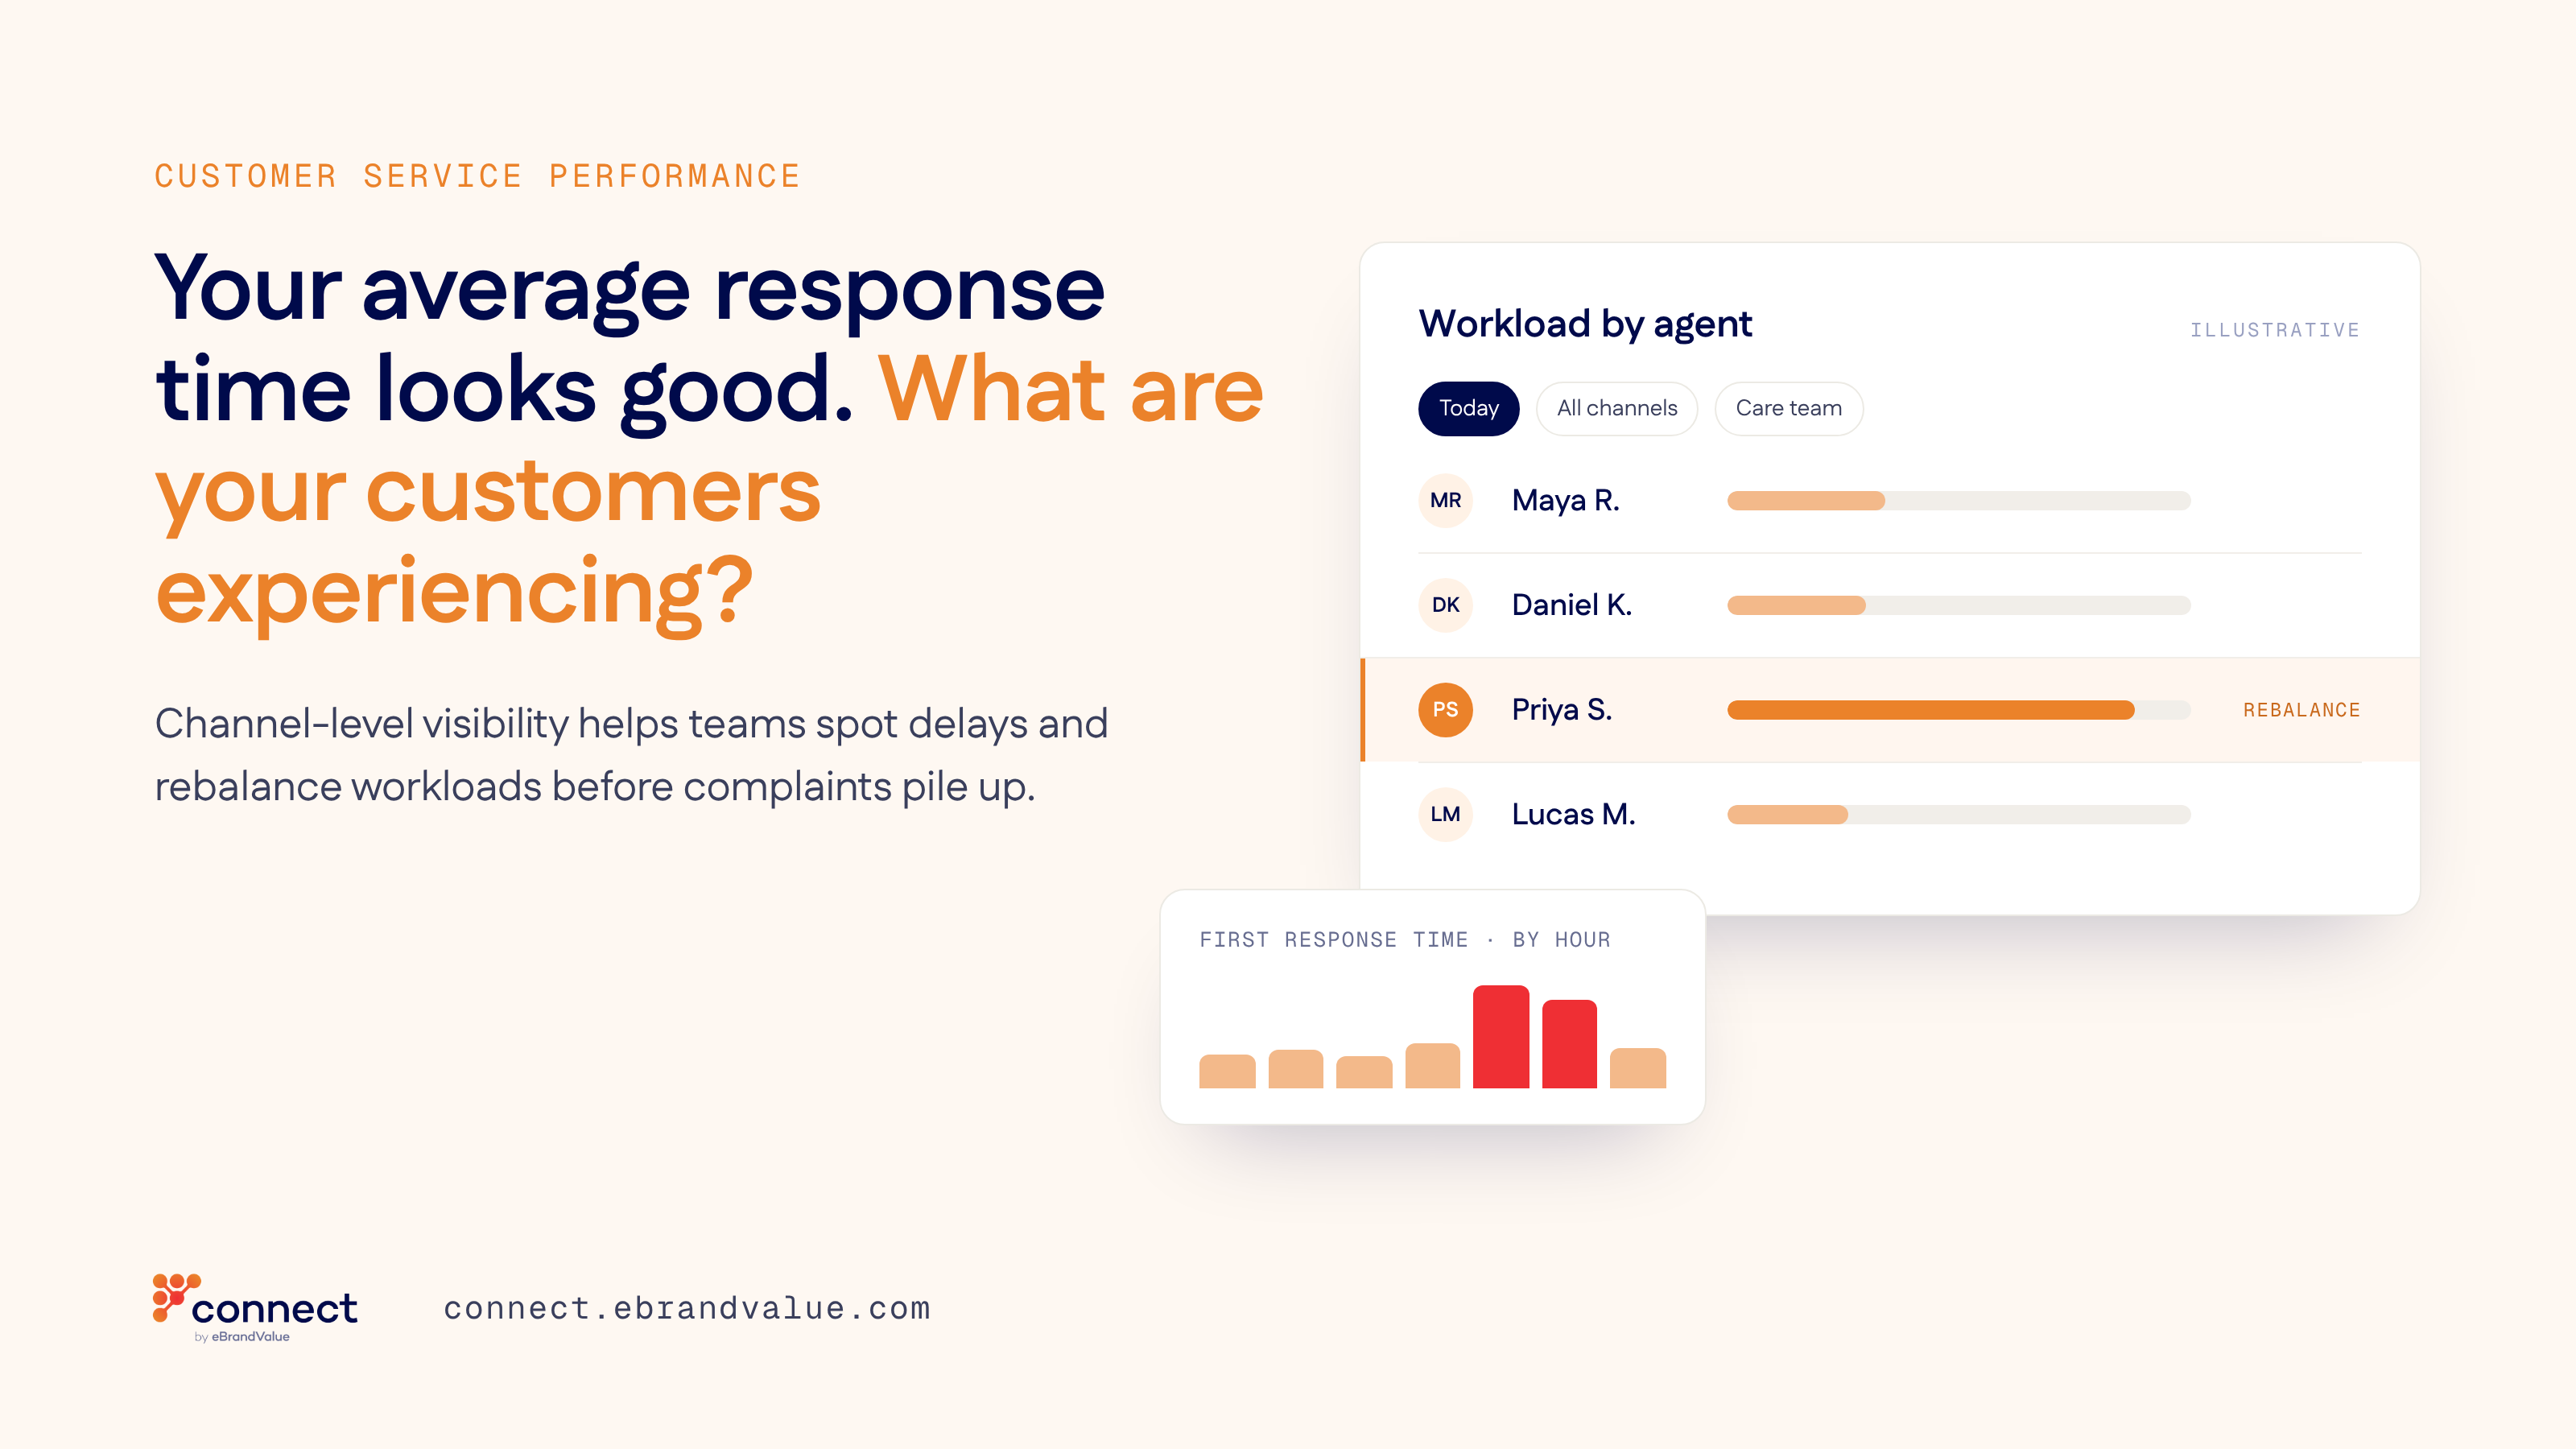
How channel-level visibility helps teams spot delays, rebalance workloads and act before complaints pile up.
Every Monday, customer care teams are asked how the previous week went. The answer usually comes from one number: the average first response time. If it is within target, the week is recorded as a good one.
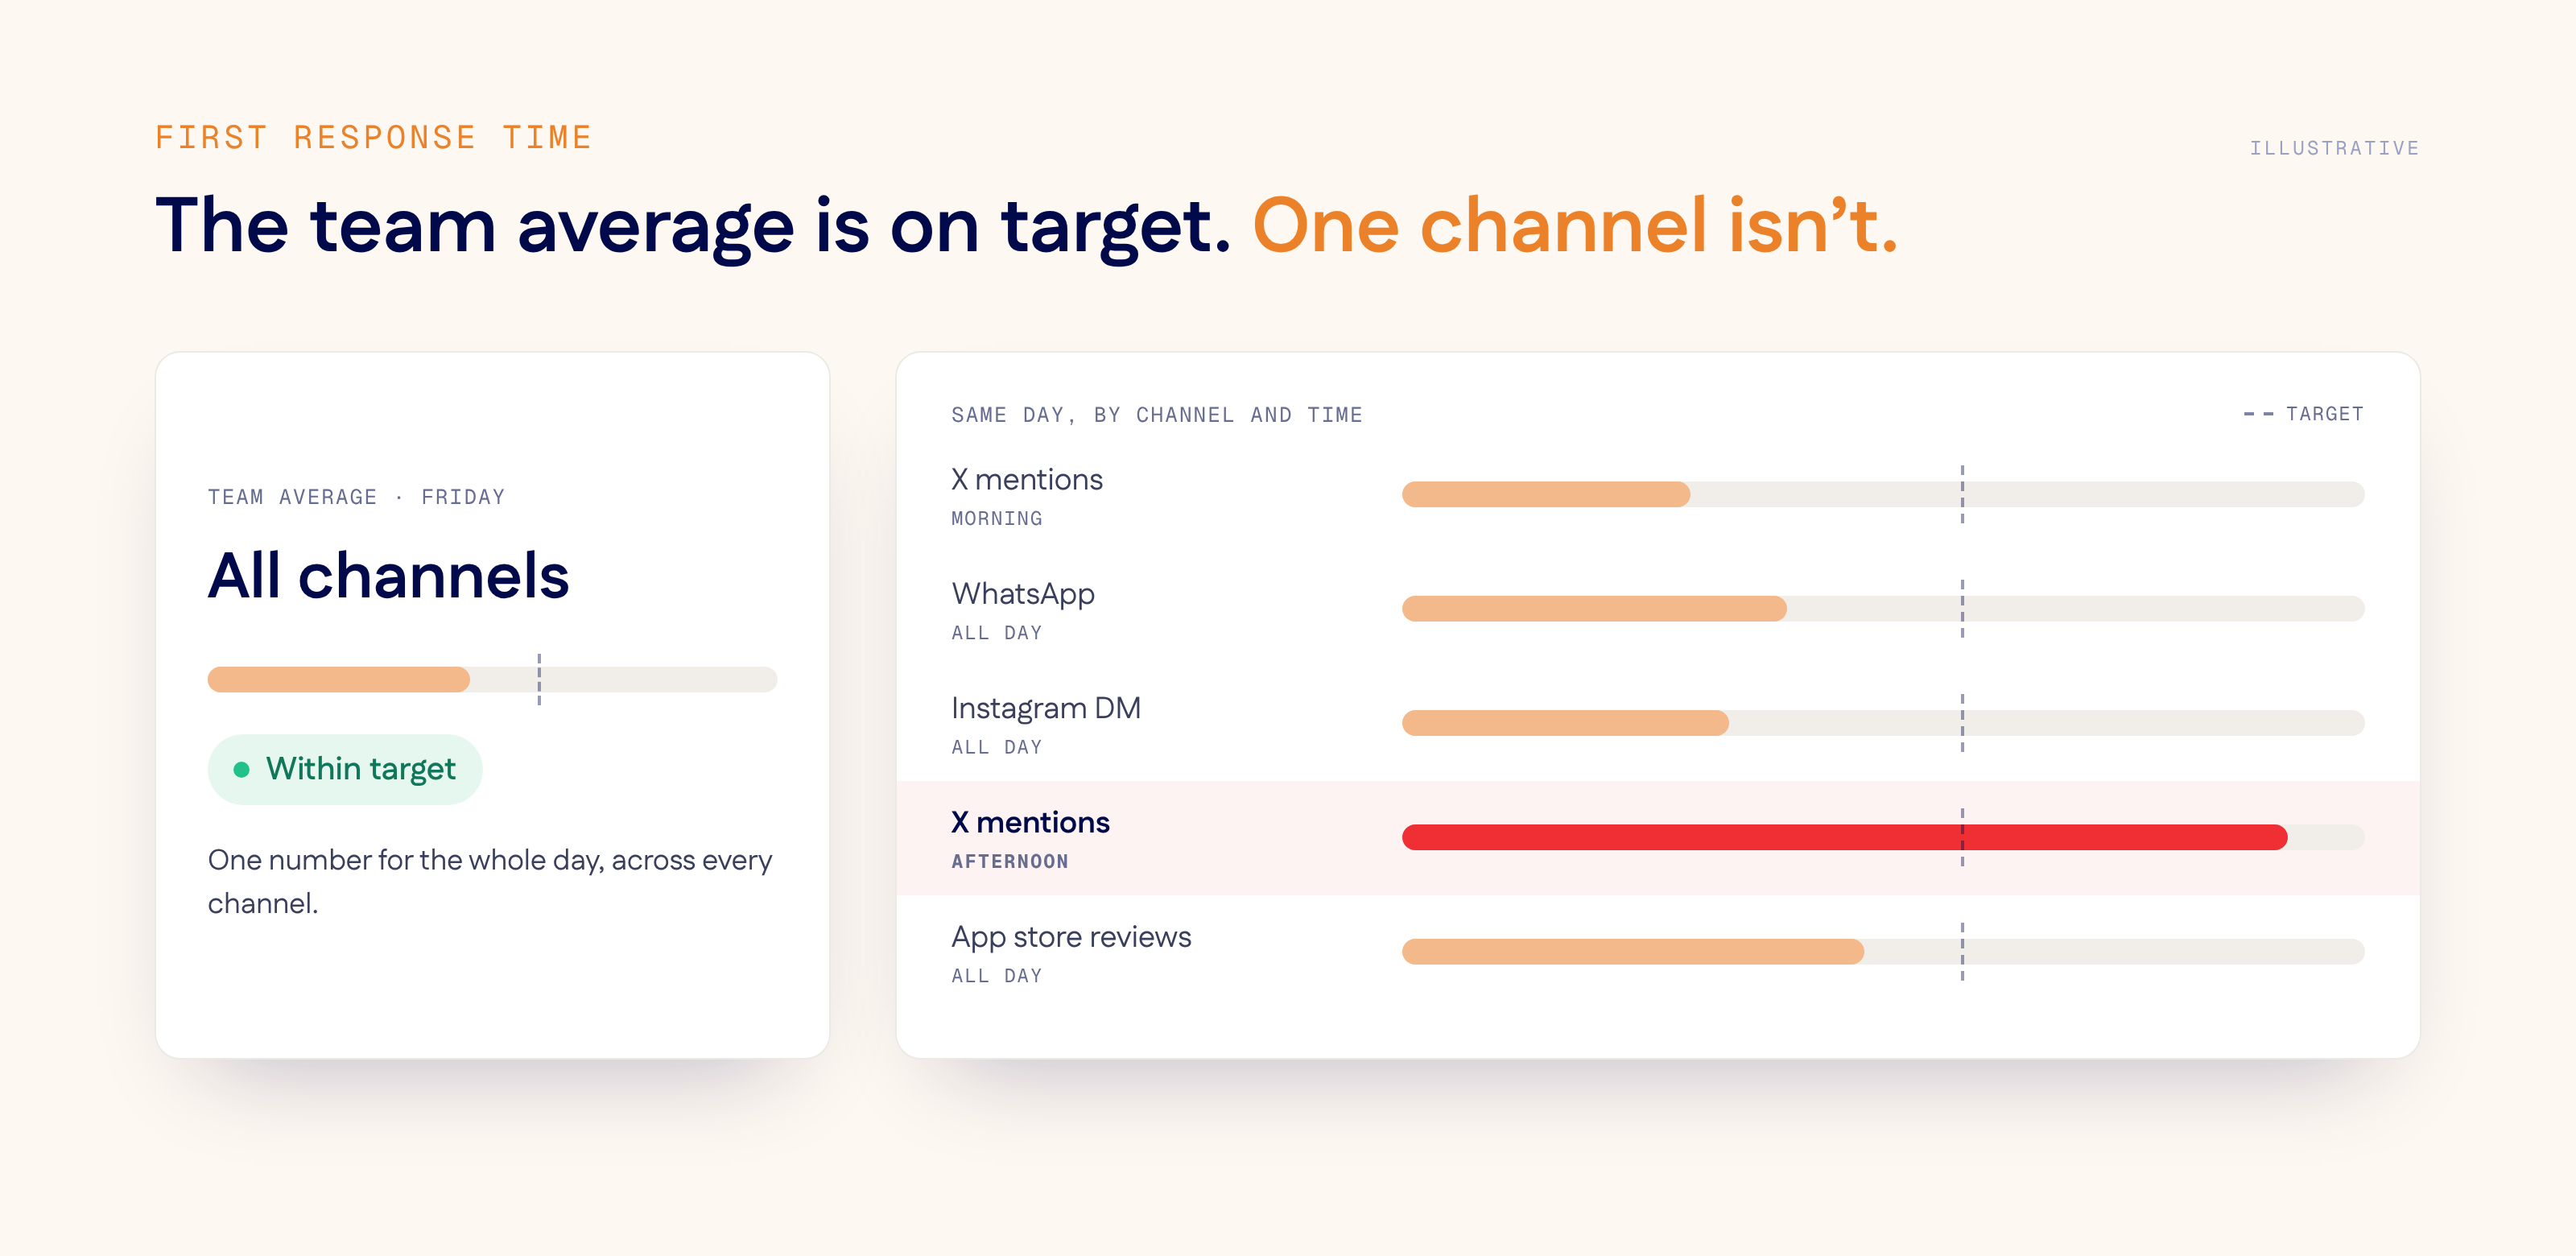
The number is accurate as far as it goes, but it does not show which channel, hour or group of customers waited longer. An average combines fast replies on some channels with slow replies on others, and the customers who waited longest disappear into it. On social channels they are also the most visible. An unanswered complaint on X stays in public view until someone replies.
A representative scenario: a Friday at a bank
The scenario below is illustrative; the bank and the team are fictional.
It is the last Friday of the month. Salaries have been paid and card spending is high. Shortly after noon, some contactless payments start being declined. Customers turn to the channels they use every day: they post on X, send WhatsApp messages and leave app store reviews.
The team lead, Leah, has five agents on shift. Maya and Daniel handle WhatsApp, Lucas and Nina cover Instagram and app reviews, and Priya covers X. Most of the payment complaints arrive on X, where customers are posting publicly. By early afternoon, Priya is holding most of the open conversations while the rest of the team works through quieter queues.
The mathematician John Kingman's queueing research explains why this matters. His 1961 work on heavy traffic shows that waiting time rises sharply as a single queue approaches full capacity. In his approximation, a queue that is busy 95% of the time keeps customers waiting almost five times as long as one that is busy 80% of the time. Priya's queue reaches that point while the team's overall workload still looks manageable.
At six in the evening, Leah checks the dashboard. The average first response time is within target. A first response time only exists once someone has replied, so the X mentions still waiting at six o'clock are not part of that average. On Monday morning, a number of Friday's X mentions are still open, and some customers have reposted their complaints with screenshots of the unanswered messages.
Three views that explain what happened
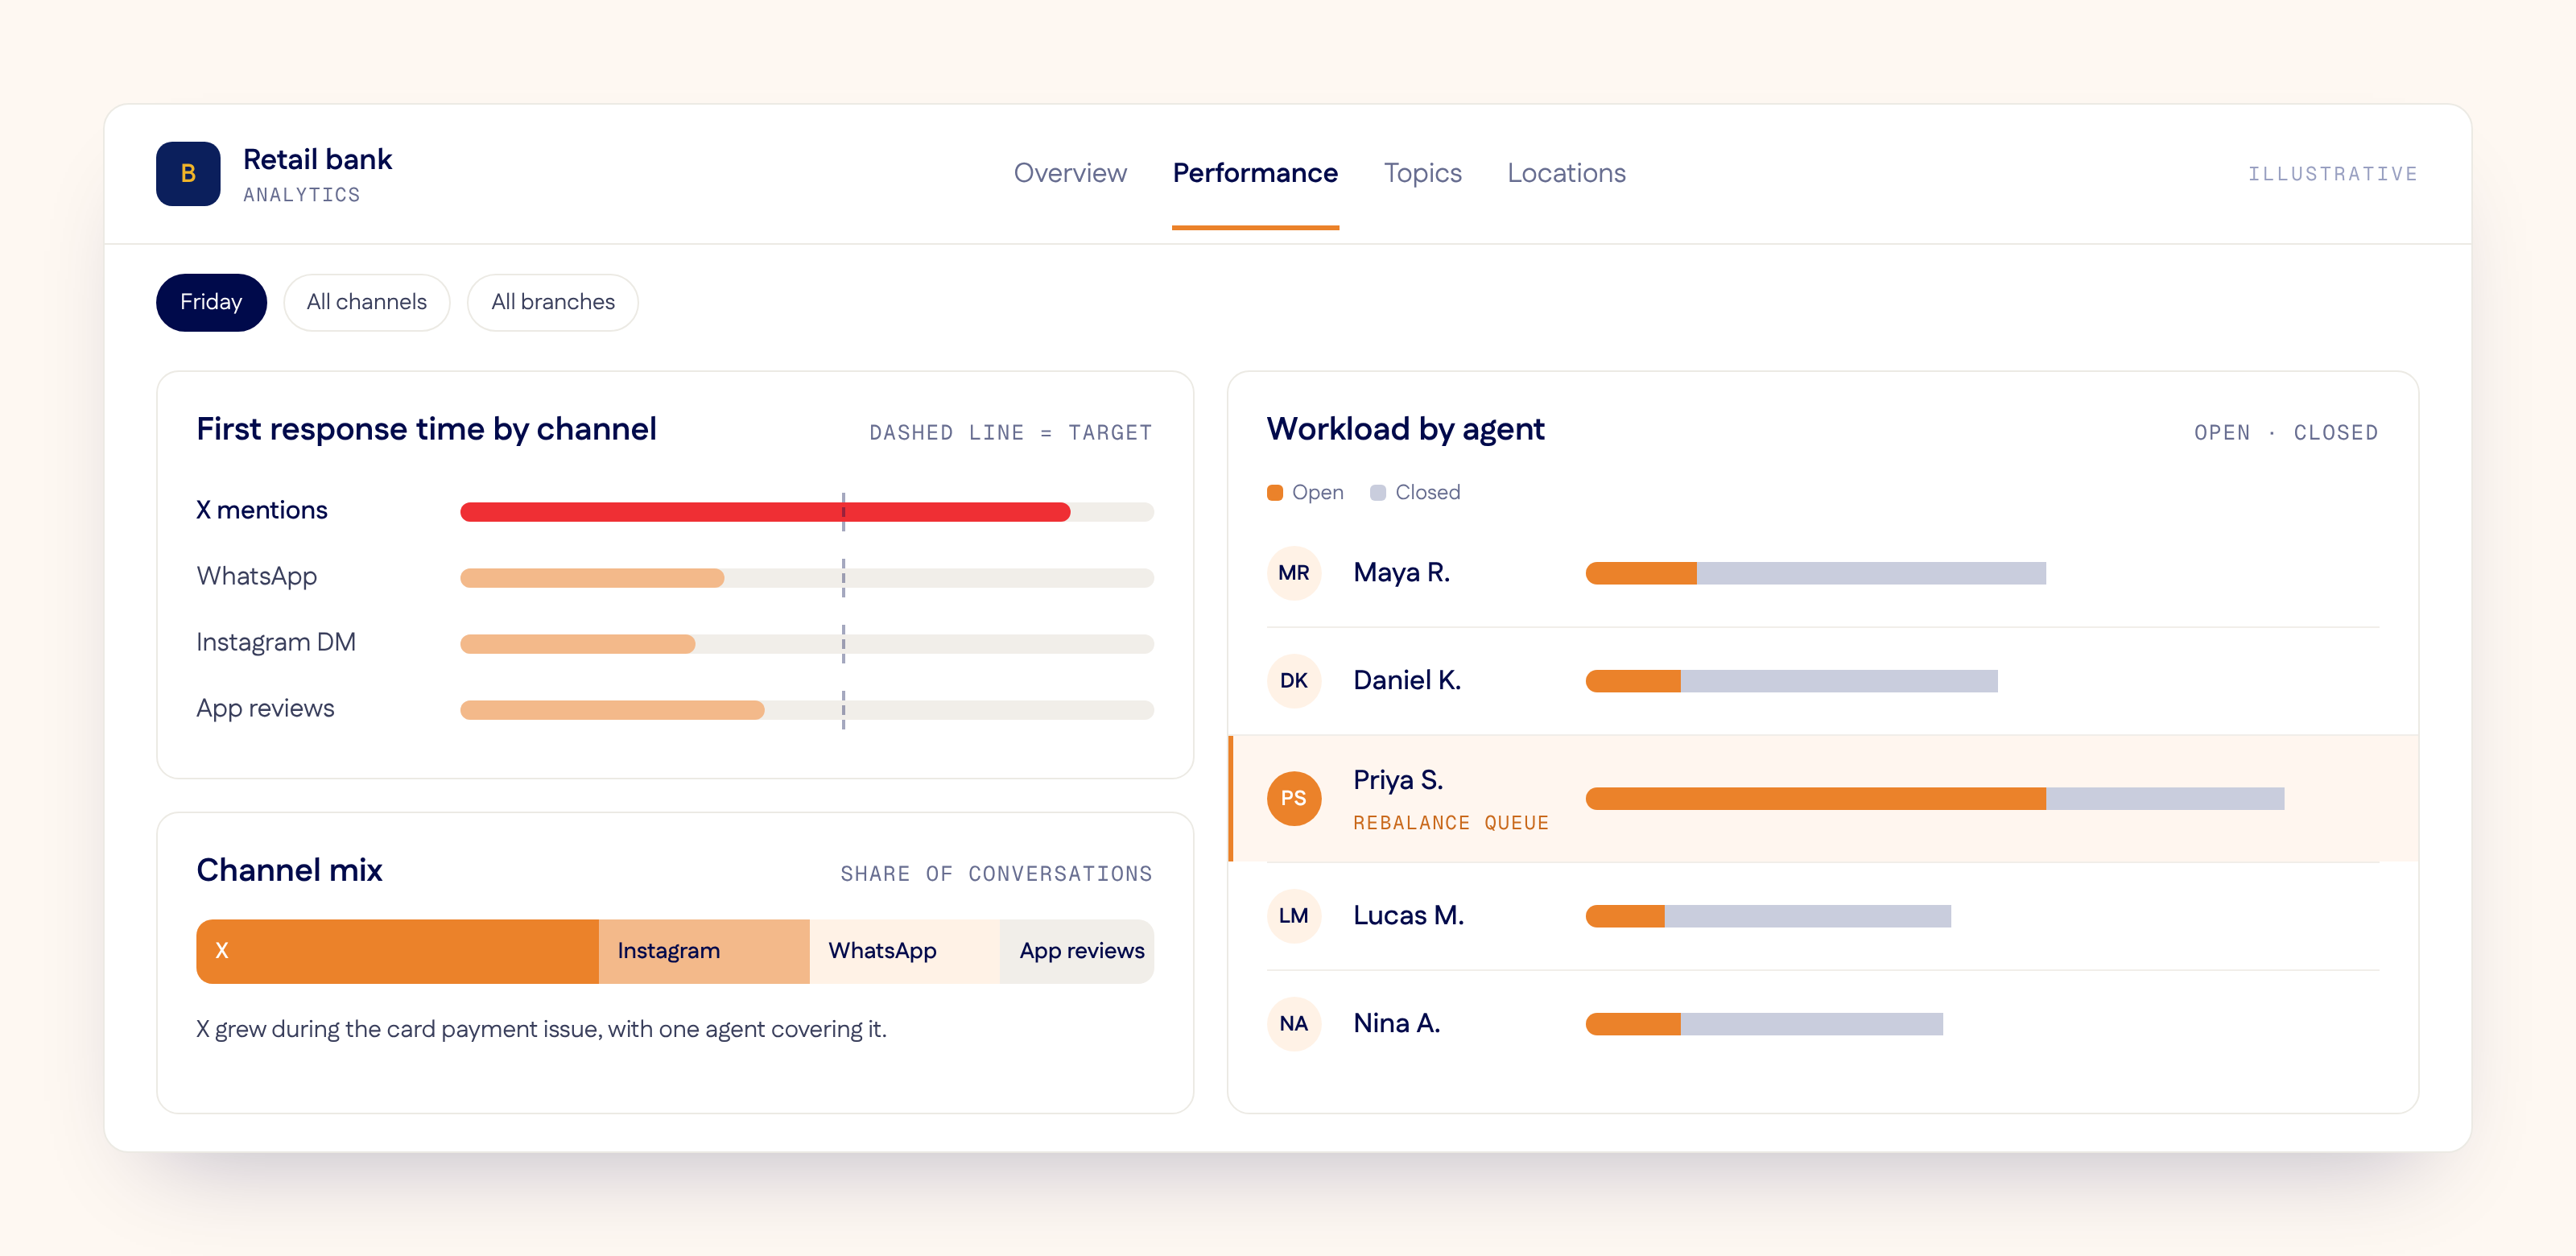
On Monday, instead of starting with the average, Leah opens three views on the Performance tab.
First response time by channel shows that WhatsApp, Instagram and app reviews stayed within target, while X in the afternoon was well above it. Workload by agent puts most of those X conversations with Priya. The channel mix explains the pile-up: X's share of volume rose sharply on a day the shift schedule had been planned like any other Friday.
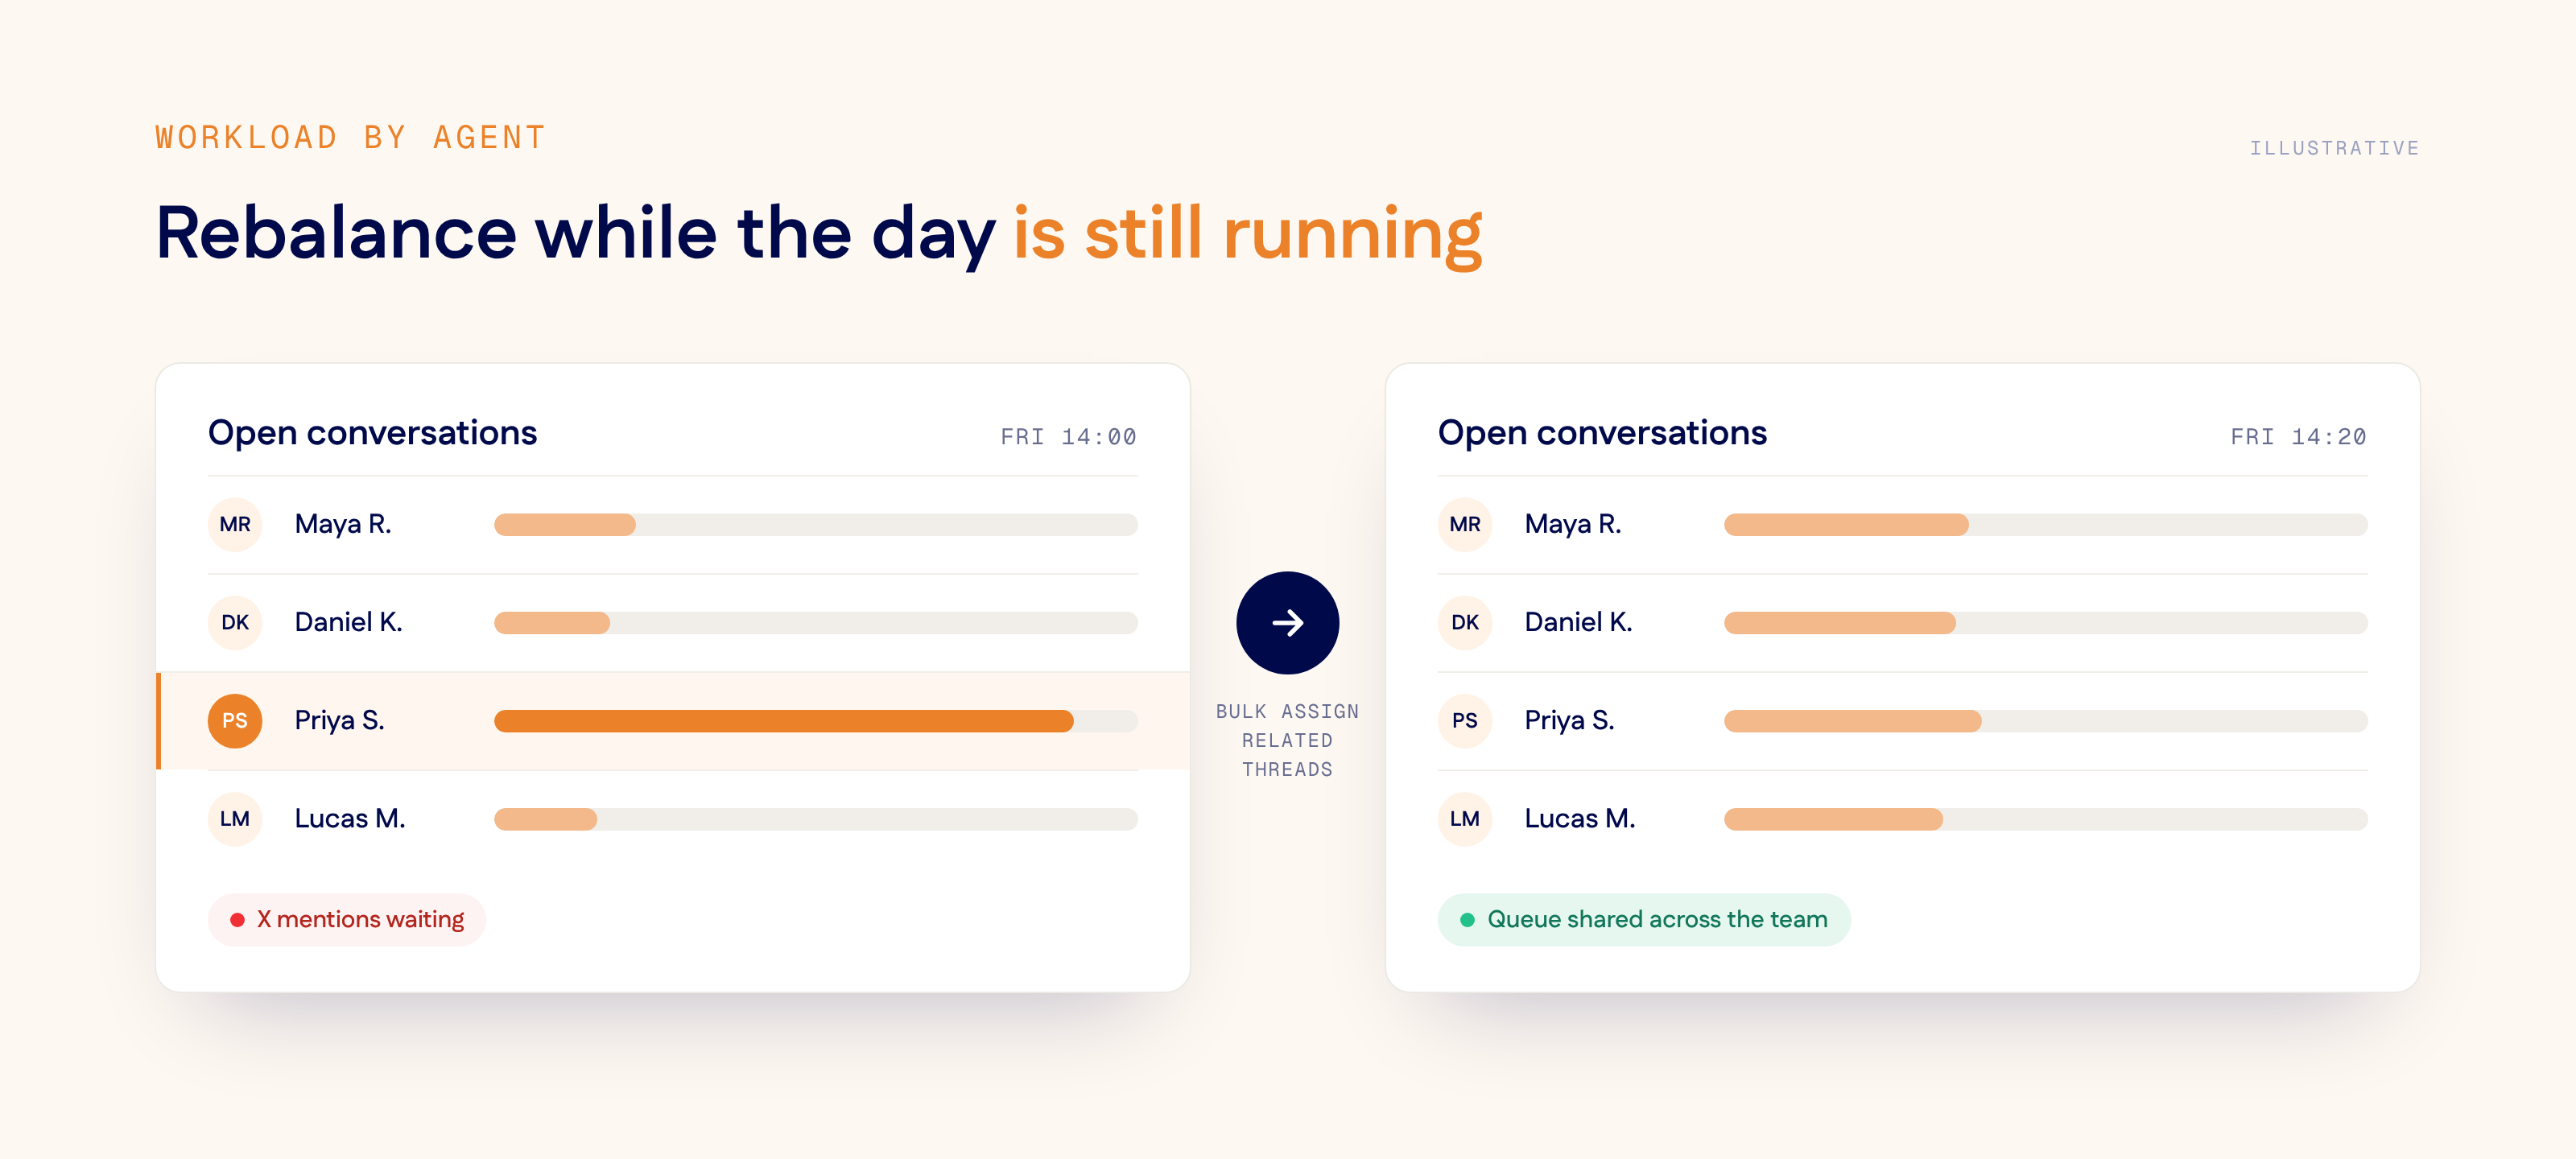
Read together, the three views point to two changes for the next spike. The first is an alert with volume and keyword thresholds, for terms such as "declined" or "contactless", so that a second agent joins X as complaints start to climb. The second is rebalancing during the shift. In Connect's Unified Workspace, a team lead can bulk assign related threads to agents with capacity instead of finding the backlog on Monday.
When the metric becomes the target
There is one change Leah deliberately avoids: ranking agents by response time.
In 1975, the economist Charles Goodhart observed that a statistical measure tends to lose its value once it is used as a target. The anthropologist Marilyn Strathern later summarized the idea as "when a measure becomes a target, it ceases to be a good measure." Emergency departments in England offer a documented example: after a four-hour waiting target was introduced, analysts noted a cluster of patients being admitted in the final minutes before the deadline.
A response-time ranking invites the same behavior. Quick acknowledgments that stop the clock become more likely than complete answers. A ranking would also have put Priya at the bottom for an afternoon she spent on the hardest queue. For Leah, the per-agent view is more useful as a map of where the team needs support.
What Monday morning should look like
The Monday review can start from the breakdowns instead of the average: first response time by channel and hour, workload by agent, channel mix across the week and backlog before each shift ends.
Leadership needs the same picture with less detail. Connect's Analytics & Performance Dashboards can be configured around your organization's structure, and the Monday summary can be saved as a report and exported as PDF or XLSX, with the channel breakdown shown next to the average.
The product tour replays a similar afternoon at a bank, from the first card-decline alert to reassigning the conversations. To see first response time, workload and channel mix side by side, take the product tour or book a demo with our team.
Frequently asked questions
What are the most important customer service performance metrics for social media?
First response time, average response time, resolution time, backlog, workload by agent and channel mix. Each is most useful when broken down by channel and time of day.
How do you calculate first response time?
Subtract the time a message arrived from the time of the first reply a person wrote or approved, then average across conversations and report the result by channel as well as overall. Decide up front whether you count business hours or calendar hours, and leave automated acknowledgments out.
Why can a good average response time be misleading?
An average blends fast and slow replies. A healthy team-wide figure can hide one channel, one afternoon or one overloaded agent where customers waited far longer. It also leaves out conversations that are still waiting for a first reply.
What is the difference between first response time and average response time?
First response time measures how long a customer waits for the first reply. Average response time measures how quickly the team keeps replying once the conversation is under way.
Connect by eBrandValue is a customer experience management platform built on eBrandValue's data engine. Learn more about eBrandValue.
See Connect in action.
Contact us to see how our social and digital customer experience workspace can support your organization.